TreeScan Basics
How can I access and use the TreeScan software?
TreeScan is free software, available for download at www.treescan.org. The TreeScan User Guide provides detailed instructions on how to use the software. It is compatible with Windows, Macintosh, and Linux Operating Systems.
How can I generate a cohort and analytic dataset that can be used with TreeScan software?
The input dataset structure required for TreeScan is printed in the TreeScan User Guide. Within the Sentinel System, version-controlled, quality-checked cohort identification programs enable creation of an analytic dataset compatible with most TreeScan analyses. These SAS programs require data formatted into the Sentinel Common Data Model and a SAS® license to execute. Additionally, TreeScan requires pre-specification of the hierarchical tree structure. Tree files based on the Agency for Healthcare Research and Quality’s (AHRQ’s) Multi-level Clinical Classification System (MLCCS) are available here.
Where can I find more information about the TreeScan statistical method?
- The basic TreeScan methodology, using a Poisson probability model, is described by Kulldorff et al.
- The Poisson model applied to pharmacovigilance is described by Kulldorff et al.
- For a description of the tree-temporal scan statistic, see Yih et al.
- For a description of a propensity-score matched design see Wang et al.
- For information about the various probability models, please consult the TreeScan User Guide.
Tree Structure of Outcomes
How is the tree generated from the data?
It is not. The tree is pre-specified by the user, before collecting the data and doing the analysis.
What qualifies as a “tree” that can be used for TreeScan?
Any structure that aggregates data into logical, hierarchical groupings is considered a “tree” and would be sufficient for our purpose. For example, MedDRA is a standardized medical terminology to share regulatory information internationally, and its concepts are organized in a tree structure. The International Classification of Diseases (ICD) coding system is also organized in a tree by body system. Finally, the Agency for Healthcare Research and Quality has created the MLCCS, which groups the ICD-9/10-Clinical Modification (CM) outcome codes into a smaller number of clinically meaningful categories.
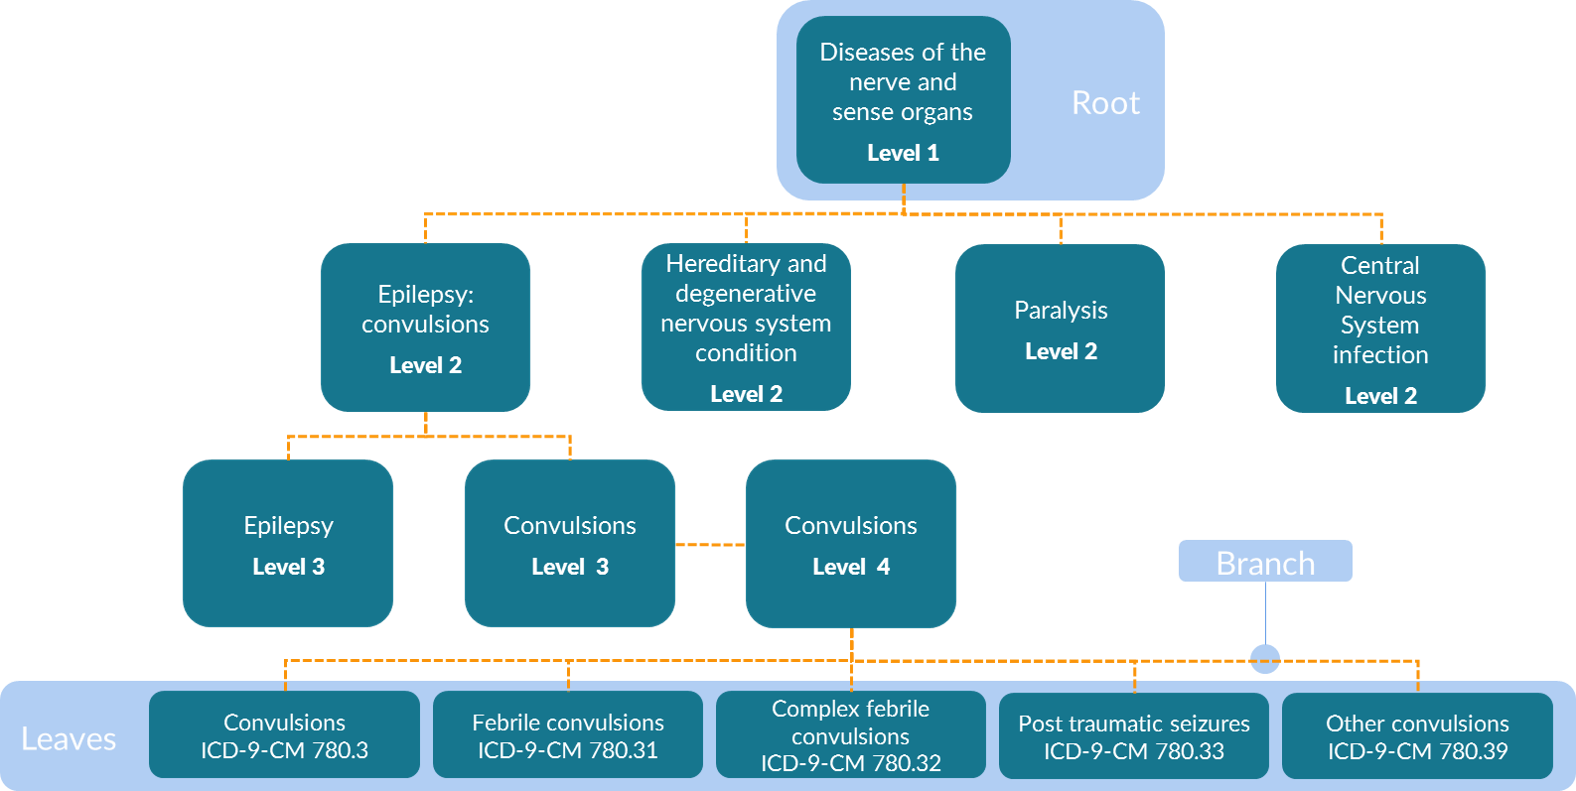
The MLCCS is a hierarchical system that is defined using both aggregate groupings and ICD-9-CM codes. Four levels exist in the multi-level diagnosis CCS in the ICD-9-CM era. That is, there are four levels of groupings in addition to one level of the base codes. These base codes are referred to as “leaves” or “leaf nodes” on the tree and are the most granular data available. The least granular of the four levels in the MLCCS are the root nodes that are aggregated into 18 body system categories (e.g., Diseases of the Nervous System and Sense Organs as shown in the figure below). The specificity of categories increases with the higher levels, such that second-level categories are more specific than first-level categories, third-level categories are more specific than second-level categories, and fourth-level categories are more specific than third-level categories. An example table is shown below.
Is it possible to execute a TreeScan analysis with both ICD-9-CM and ICD-10-CM codes in the same study, i.e., perhaps because the study spans periods when both ICD-9-CM and ICD-10-CM codes were in use?
Yes. One common tree must be used. This can be created by mapping ICD-9-CM codes onto ICD-10-CM codes or vice versa or by basing the common tree on a combination of ICD-9-CM and ICD-10-CM codes.
How does the TreeScan method account for potential differences in how outcomes are coded in administrative data?
One of TreeScan’s strengths is that an investigator is not required to pre-specify how a clinical concept will be coded in administrative data. For example, different physicians could code an outcome slightly differently, for example, coding a febrile seizure
- convulsions (780.3),
- or febrile convulsions NOS (780.31),
- or complex febrile convulsions (780.32)
Hypothesis testing done at more coarsely-aggregated levels of the tree can combine strength even when a singular outcome or leaf level node does not have a large enough sample size to independently cause a rejection of the null hypothesis. However, there are fundamental limitations to using administrative claims data for medical product safety surveillance that will not be automatically overcome with TreeScan (no matter what its inherent strengths), such as undercoding or missingness of various common conditions (e.g., fever) for which medical care is not sought and claims are not filed. Administrative data is also subject to “upcoding” and is heavily influenced by reimbursement policies.
Why is an incident outcome defined based on the second, third, or fourth level of the outcome tree rather than on ICD-9/10-CM codes?
Many ICD-9/10-CM codes are similar, and the same disease condition may be recorded using slightly different ICD-9/10-CM codes during follow-up visits.
Using TreeScan, an outcome is incident if there were no other outcomes in the same user-specified level of the tree during the preceding pre-specified number of days. What are the pros and cons of using the second vs. third vs. fourth level (i.e., numerically higher levels are closer to the leaf level) of the hierarchical tree to identify incident outcomes? How does the definition of incident outcome impact the TreeScan results and the ability to detect alerts?
A trade-off exists in choosing any tier of the outcome tree (e.g., second, third, fourth levels) for defining incident outcomes. Defining incident events at the second level results in fewer diagnostic events compared to defining them at the third or fourth level, leading to a smaller sample size. Using the fourth level leads to a larger sample size. The additional diagnostic events can either reduce statistical power if they are random noise due to pre-existing conditions recorded during follow-up visits, or they may increase statistical power if they are informative diagnostic events unrelated to pre-existing conditions. Increased power will increase the sensitivity of the method, that is, the ability to detect true adverse reactions.
Wouldn’t the choice of the third level to define incident outcomes cause an increased frequency of second- or fourth-level outcomes in the risk window to be missed?
In this example, the third level is used to determine if an outcome is incident or not. Hypothesis tests are not performed at levels higher than the outcome incidence level to prevent data dependencies in the tree; that is, there would be no hypothesis testing at the second level. The TreeScan method can generate an alert at the incident outcome level or numerically higher (i.e., more granular) levels of the tree.
What happens if there are outcomes that are not more finely differentiated than at the second level of the MLCCS tree? How is such an outcome taken into consideration if incident outcomes are determined using a higher level?
We refer to the ICD-9-CM codes that form the basis of the tree that we use as the fifth-level (i.e., in tree parlance, the leaf level), and hence, that level exists for all outcomes. Aggregation of multiple leaves (i.e., into a branch or trunk of the tree) occurs at the first through fourth levels. Sometimes, the MLCCS tree ends at the second or third levels. In such cases, we have artificially filled in the tree up to the finest level of aggregation, i.e., the fourth level. For example, ICD-9-CM code 729.5, “pain in soft tissues of the limb,” corresponds to a second level outcome on the tree, 13.08, in which the first level 13 is “diseases of the musculoskeletal system and connective tissue” and the second level 08 is “other connective tissue disease.” There is no finer MLCCS differentiation of this outcome, but additional levels were created for it by adding zeroes — the third level is 13.08.00 and the fourth level is 13.08.00.00.
What is the purpose of defining and using incident outcomes, rather than using all recorded outcomes?
An outcome is an incident outcome if there is no prior outcome of the same or similar kind in the prior “X” days. The primary goal of the incident outcome definition is to identify only new-onset events and distinguish them from ongoing conditions that existed before medical product exposure. By removing such ongoing conditions, the signal-to-noise ratio increases, which in turn increases statistical power. A second reason for using only incident outcomes is to ensure that a person can only contribute one event during the follow-up period in the same grouping of outcomes in the tree. This is further accomplished by ensuring that the number of days used in the incident outcome definition is longer than the follow-up time. Together, these operational characteristics help to ensure the independence assumptions that underlie the TreeScan probability models.
Instead of using the same rules to define incident outcomes, set the observation period, etc., for all outcomes, wouldn’t it make more sense to tailor the rules to the various outcomes, some of which would have more acute and/or immediate onsets than others?
Customization of the rules for specific outcomes is not feasible with a method of this kind, where there are thousands of different outcomes being assessed. This is an early-warning, alert-detection system. Definitions of incident outcomes, risk intervals, and other parameters can and should be customized in subsequent alert investigations.
Epidemiologic and Statistic Issues
What does a “TreeScan alert” mean?
A TreeScan alert occurs when TreeScan detects a statistically significant difference in the observed frequency of a coded outcome relative to the expected counts depending on the specific tree-based scan statistic being utilized. The tree-based scan statistic is a maximum log likelihood ratio and the threshold is given based on the percentile value of the maximum log likelihood ratio distribution. The threshold is user-specified. Adjustments are made for multiple testing, so the alerts are unlikely to be due to chance. An alert could be expected (i.e., a labeled outcome), or unexpected. If unexpected, the TreeScan alert should be further evaluated for its likelihood of being due to confounding using traditional pharmacoepidemiologic methods.
Is it likely or unlikely that there will be statistical alerts just due to chance?
It is unlikely, since the method adjusts for the multiple testing inherent in the thousands of outcomes and groups of related outcomes that are evaluated. Suppose you use an alpha level of 0.05, declaring an alert when p≤0.05. If you perform 100 TreeScan analyses, the expected number of TreeScan analyses without any alerts due to chance is 95. If the null hypothesis is true, then the expected number of TreeScan analyses without any alerts at all is 95. In other words, in the long run, 5 percent of your TreeScan analyses will contain a false positive alert that is due to chance. If this is considered too high, you can instead use an alpha level of 0.01. Then, in the long run, only 1 percent of your TreeScan analyses will contain a false positive alert that is due to chance.
What kind of investigations will be undertaken if and when unexpected safety alerts arise from TreeScan analysis, and how will decisions about those investigations be made?
In general, the approach is as follows: We will first identify whether alerts correspond to a known or expected association, such as those noted in the product label. Then, of the remaining alerts, we will consider the potential biases that might have been operating and the strength of the bias needed to generate a false alert. We may perform additional alert follow-up under the guidance of the Food and Drug Administration (FDA) using other analyses or the Patient Episode Profile Retrieval Tool.
If TreeScan alerts arise, how can we be sure that the alert is not related to one particular Data Partner?
Any alert investigation will consider the possibility that a TreeScan alert is Data Partner-specific and will include stratification of data by Data Partner.
How is the FDA going to use data that have been used for a TreeScan analysis to follow-up an alert?
Any alert investigation will include a) pre-specification and transparency of the follow-up analysis plan and subsequent results, and b) proper attention to statistical testing (i.e., overall type I and type II error control). In general, an alert investigation is not intended to replicate a TreeScan finding, but rather to refine evidence generation and understand any biases or confounding that may have contributed to an alert.
A higher frequency of healthcare visits and outcome codes has been observed in the first two weeks after medical product initiation than subsequently, usually due to workup of conditions that were present at the time of medical product initiation and diagnosed shortly thereafter. Wouldn’t you expect false TreeScan alerts to arise due to this phenomenon?
In a self-controlled design when time periods are being explicitly compared, it is easy to test by comparing the total outcomes in different periods after medical product initiation. When present, it can bias the unconditional Bernoulli (i.e., when applied to a self-controlled design) and the unconditional tree-temporal scan statistics. On the other hand, the conditional versions of the tree-based scan statistics are explicitly designed to adjust for this type of bias, although they will only adjust for the general phenomenon across all outcomes, not for an exceptionally strong time bias for a specific outcome. The latter must be dealt with using a follow-up analysis that is specific to that outcome and accounts for time-varying variables.
How is the adjustment for multiple testing implemented?
Considering the thousands of overlapping disease outcome definitions evaluated, adjustment for multiple testing is critical. This is accomplished through the simulation component of the method. The maximum log likelihood ratio test statistic in the real dataset is compared with the maximum log likelihood ratio test statistics in each of, say, 999 random datasets, and we note its rank. For example, if it has the fifth highest test statistic, its rank is 5. Note that we are not comparing the specific log likelihood ratios for specific nodes on the tree, but rather, comparing the maxima of the log likelihood ratios obtained over all possible nodes. Since the random datasets were all generated under the null hypothesis, and if the null hypothesis is true in the real dataset, then the test statistics come from exactly the same probability distribution. This means that, if the null hypothesis is true, then the rank of the test statistic from the real dataset will range uniformly from 1 to 1000, and the probability of having a rank in the top 5% is exactly 5%. If the test statistic from the real dataset is in the top 5%, we will reject the null hypothesis; we have a 5% probability of falsely rejecting the null.
Why isn’t a Bonferroni type of adjustment used to adjust for the multiple testing?
Because the overlapping data are obtained from different nodes on the tree, where the data for one node are a subset of the data in another node, there is a lot of dependence between the likelihoods calculated for closely related nodes. With such dependence, a Bonferroni type of adjustment becomes too conservative.
Could bias enter a TreeScan analysis as a result of differences in recommendations for use of the product (including the timing of rollout) among different demographic subgroups, such as males vs. females?
In using a self-controlled version of TreeScan, there would be no bias introduced by differential use of the product by different subgroups, nor by differences in the timing of rollout to different subgroups. In propensity-score or multi-factor matched analyses, these biases are mitigated by the use of active comparator groups and attention to the time periods under consideration.
What if only one subgroup of the population has an excess product-associated risk of an outcome, while there is no excess risk for the rest of the population? For example, maybe a medical product increases the risk of seizures in just females or in just a particular age group. Will TreeScan be able to detect the risk and identify the subgroup?
This would be a case of effect modification (interaction). If an excess risk were limited to a particular demographic subgroup of the population, the statistical power to see it would be reduced due to the random noise caused by the random timing of the outcome events in the unaffected subgroups, reducing the signal-to-noise ratio. If the sample size were big enough, TreeScan could detect it, but without identifying the subgroup. The group at risk could then be identified during an investigation of the TreeScan alert. That being said, if an investigator were concerned about subgroup-specific effects a priori, then the investigator could subset the population under investigation at the outset. For example, the population of interest could be defined as pregnant women, provided such a population could be identified in administrative data.
What are likely sources of confounding in TreeScan analysis?
Confounding adjustment is all done through design in a TreeScan analysis. Self-controlled designs automatically adjust for all time-invariant confounders, but they do not adjust for time-varying confounding except for overall patterns of medical care utilization in the conditional version of the tree-based scan statistics. Examples of possible sources of time-varying confounding are seasonality, concomitant drug exposures, and varying health status over the time period of observation. For example, there is time-varying confounding by indication when a person is temporarily indicated or contraindicated to receive a particular medical product, e.g., certain medications avoided during pregnancy. In a propensity-score matched or multi-factor matched design, confounding adjustment relies on the specification of the propensity score model or the exact matching criteria. These active comparator designs are less vulnerable to time-varying confounding.
Can TreeScan be used to identify statistically protective effects as well as excess risks? If so, how?
Currently, this cannot be done when using the Poisson or tree-temporal versions of the TreeScan software, because a one-sided statistical test is implemented. A future version of TreeScan will be able to do two-sided tests. Theoretically, when using the TreeScan Bernoulli option, it is possible to do a one-sided test for a protective effect by simply redefining the risk interval as the control interval and the control interval as the “protective interval.” In propensity-score or multi-factor matched designs, one might simply perform two analyses, and change the “referent” cohort in each analysis.
Method Validation
Since there is no gold standard against which to compare the TreeScan results, could some or all of the following kinds of analyses be done for validation purposes?
-
Conduct a power evaluation by creating simulated data spiked with an excess frequency of a particular outcome of interest during the risk window using different relative risks, different sample sizes, and different baseline frequencies of the outcome of interest.
-
Yes, this is one important way to evaluate the ability of the method to detect statistically significant differences in the frequency of the outcome of interest among two user groups. The following publications or reports address these types of power studies: Data Mining for Adverse Drug Events With a Propensity Score-matched Tree-based Scan Statistic and Postlicensure Medical Product Safety Data-Mining: Power Calculations for Bernoulli Data.
-
-
Divide the dataset into two random subsets, perform a TreeScan analysis on each one, and compare the results.
-
Not recommended for either validating the TreeScan method or validating TreeScan findings. Since the two datasets are randomly obtained from the same larger dataset, any difference between the results of the two analyses will, by definition, be due to chance. Moreover, once we have shown that the results from the comparison are the same or very similar, we will still not have proven that they are both accurate results instead of both erroneous results. Hence, it is not a useful way to evaluate the method. Using only part of the available data would reduce statistical power, so it is also not a recommended approach to use only half the data for the actual analysis and save the other half for validating the findings.
-
-
Divide the dataset in two (e.g., 2006-2011 vs. 2012-2014, or Data Partners A and B vs. C and D), perform TreeScan analysis on each half, and compare the results.
-
Not recommended for validating either TreeScan findings or the method. Using only part of the available data would reduce statistical power, so it is not a recommended approach for validating actual findings. However, the investigator might choose to subset the data by time period based on their awareness of secular trends (e.g., significant changes in coding practices over time) or of other forms of time-varying confounding that could introduce a bias. That being said, unlike the question above, subsets of data originating from different periods of time and/or different Data Partners could differ. Hence, any difference in TreeScan results could be due either to that reason or to random chance. Also, as in the question above, even if we were to find that the results from the comparison were the same or very similar, we would not have proven that they were both accurate results instead of both erroneous results.
-
-
Divide the available data into two random subsets and perform a TreeScan analysis on one and a conventional regression analysis on the other.
-
Not recommended for validating TreeScan findings, but could be used for methods validation. We could run TreeScan on one randomly selected half of the dataset, note the statistically significant alerts, and then use a non-data-mining method, such as standard logistic regression, on the other half of the dataset to demonstrate that the TreeScan alerts are statistically significant using standard methods. When using the standard method, we would not have to adjust for multiple testing, since we would be running the analysis on a completely independent, non-overlapping dataset, for a few previously detected outcomes. This exercise could serve an educational purpose in confirming the TreeScan alerts using a widely known and established method. It must be noted, however, that this approach should not be used for validating actual TreeScan findings, as power would be greatly reduced.
-
-
Use another established signal detection method on the same dataset as TreeScan and compare results.
-
Recommended for methods validation, and acceptable, with a caveat, for data analysis and validation of actual findings. One such comparison has already been done, for evaluation purposes, in which TreeScan was compared with the Gamma Poisson Shrinker (GPS), a method that is commonly applied in spontaneous reporting systems.1 Another is planned for self-controlled designs: Evaluation of Three Self-Controlled Methods for Signal Detection: TreeScan, Sequence Symmetry Analysis, and Information Component Temporal Pattern Discovery. For actual analysis, it is sometimes good to use multiple methods, but one must also be careful not to use so many different methods that at least one of them will generate a statistically significant result just by chance.
-
References
1. Brown JS, Petronis KR, Bate A, et al. Drug adverse event detection in health plan data using the Gamma Poisson Shrinker and comparison to the tree-based scan statistic. Pharmaceutics, 2013;5:179-200.
Jacobsen SJ, Ackerson BK, Sy LS, et al. Observational safety study of febrile convulsion following first dose MMRV vaccination in a managed care setting. Vaccine, 2009;27:4656-4661.
Klein NP, Fireman B, Yih WK, et al. Vaccine Safety Datalink. Measles-mumps-rubella-varicella combination vaccine and the risk of febrile seizures. Pediatrics, 2010;126:e1-8. doi: 10.1542/peds.2010-0665.
Kulldorff M, et al. A Tree-Temporal Scan Statistic for Drug and Vaccine Safety Data Mining. Manuscript, 2014.
Kulldorff M, Dashevsky I, Avery TR, et al. Drug safety data mining with a tree-based scan statistic. Pharmacoepidemiology and Drug Safety, 2013;22:517-523.
Kulldorff M, Fang Z, Walsh SJ. A tree-based scan statistic for database disease surveillance. Biometrics, 2003;59:323-331.
McClure DL, Raebel MA, Yih WK, et al. Mini-Sentinel methods: Framework for assessment of positive results from signal refinement. Pharmacoepidemiology and Drug Safety, 2014;23:3–8. doi: 10.1002/pds.3547.
Yih WK, Kulldorff M, Fireman BH, et al. Active surveillance for adverse events: The experience of the Vaccine Safety Datalink project. Pediatrics, 2011;127:S54–S64.